Build a dashboard
Build a dashboard when you want to see how the work is going at a glance, for example:
- how many tasks are open;
- what is overdue;
- what got done this week.
A dashboard is a view of the Dashboard view type, filled with widgets. Dashboard V2 is a separate view type for task charts, including a single Number.
Before you start
Decide which tasks the dashboard should count. They come from the view's sources:
- a list or a folder;
- several workspaces, in a personal view.
The dashboard counts the tasks from those sources that match the view's filter. Change them in the view's header:
- the Sources chip: which lists, folders or workspaces the view draws from;
- Filter: which of their tasks count (Filter, sort and group a view);
- the Slice chip: whether subtasks count, with Tasks, Tasks and subtasks or Subtasks only.
By default a dashboard counts Tasks and subtasks.
New dashboard view
Open the … menu of a list, folder or workspace and choose New view, or click + (Create) → New view for a personal one. The new view form opens.
A shared dashboard needs view permissions
A dashboard in a list or folder can be shared or private. Creating either requires Edit access to the list or folder and a permission set that can create views; editing it later requires Edit access to the view and a permission set that can update views. A personal dashboard needs neither. See Permissions and access.
Type a name in Name, such as
Weekly. The view carries this name in the sidebar.In Display Mode, choose Dashboard (what each view type shows: Views compared). Dashboard is selected.
In Source, pick the workspaces, folders or lists whose tasks the dashboard counts. From a list, the source is that list and can't be changed.
Click Create. The view opens with Empty dashboard.
Add widgets
Click Add widget. The Widget Store opens on All. Each section and each widget carries a line on what it shows.
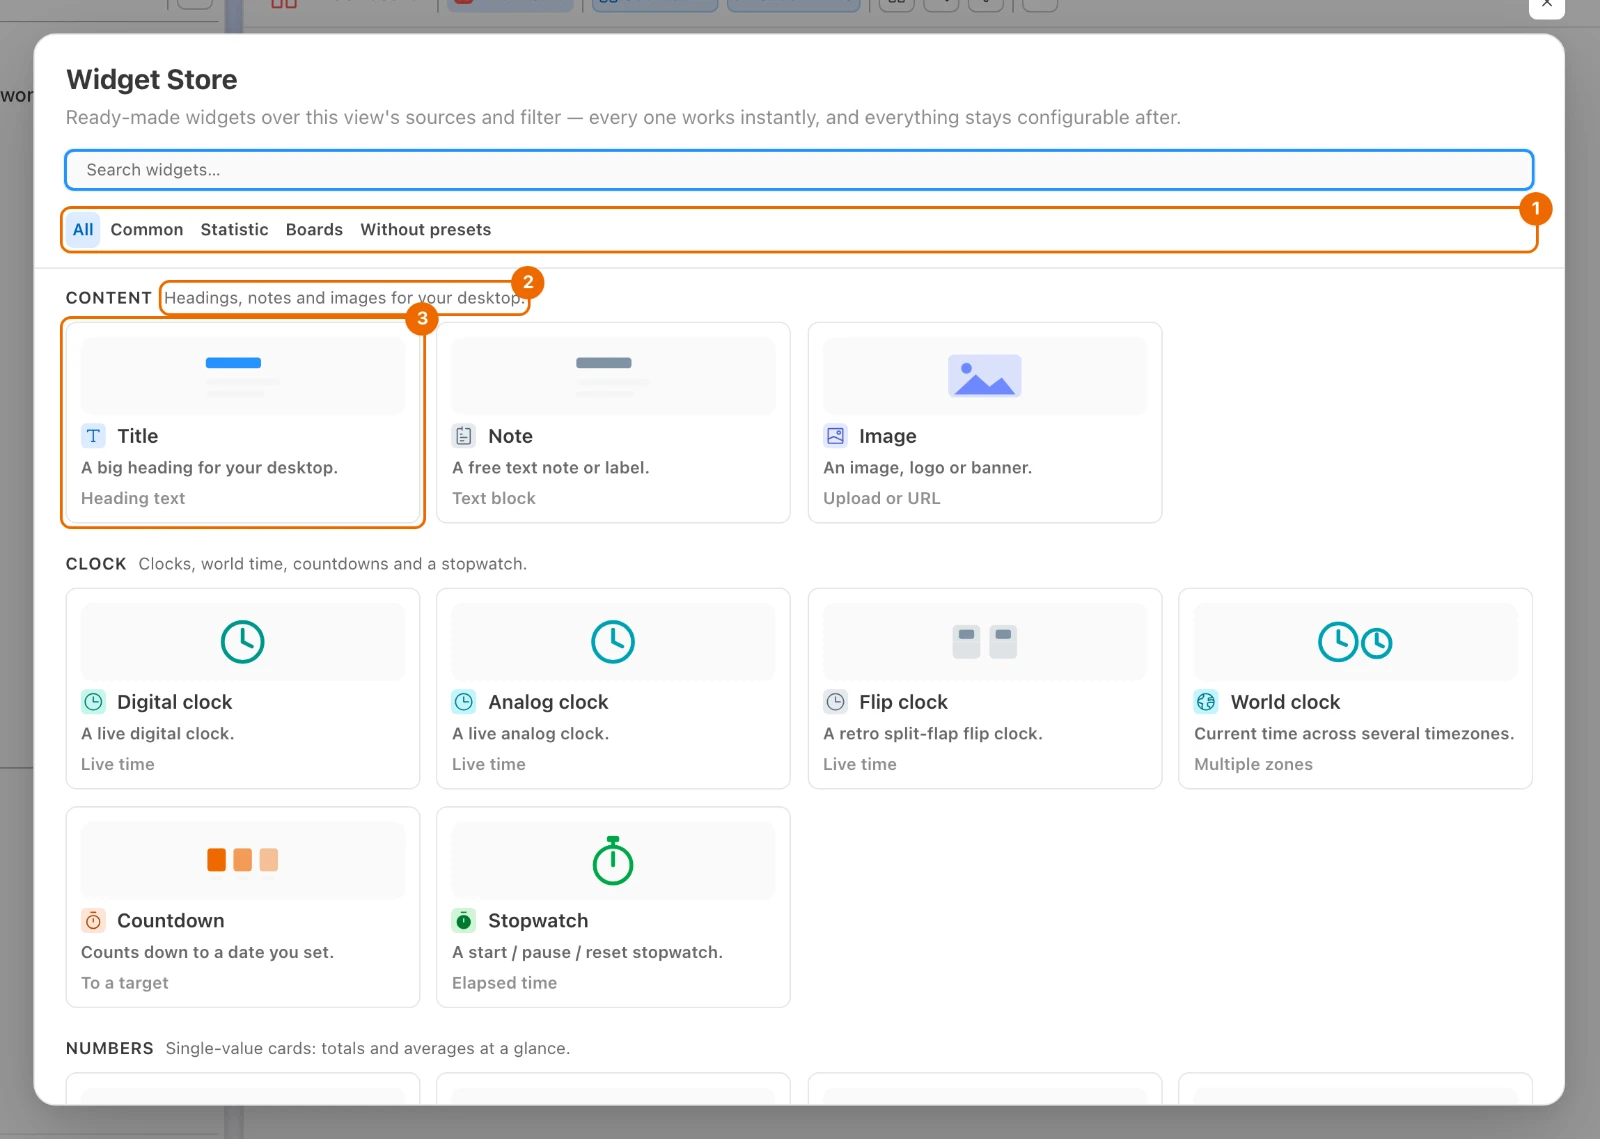
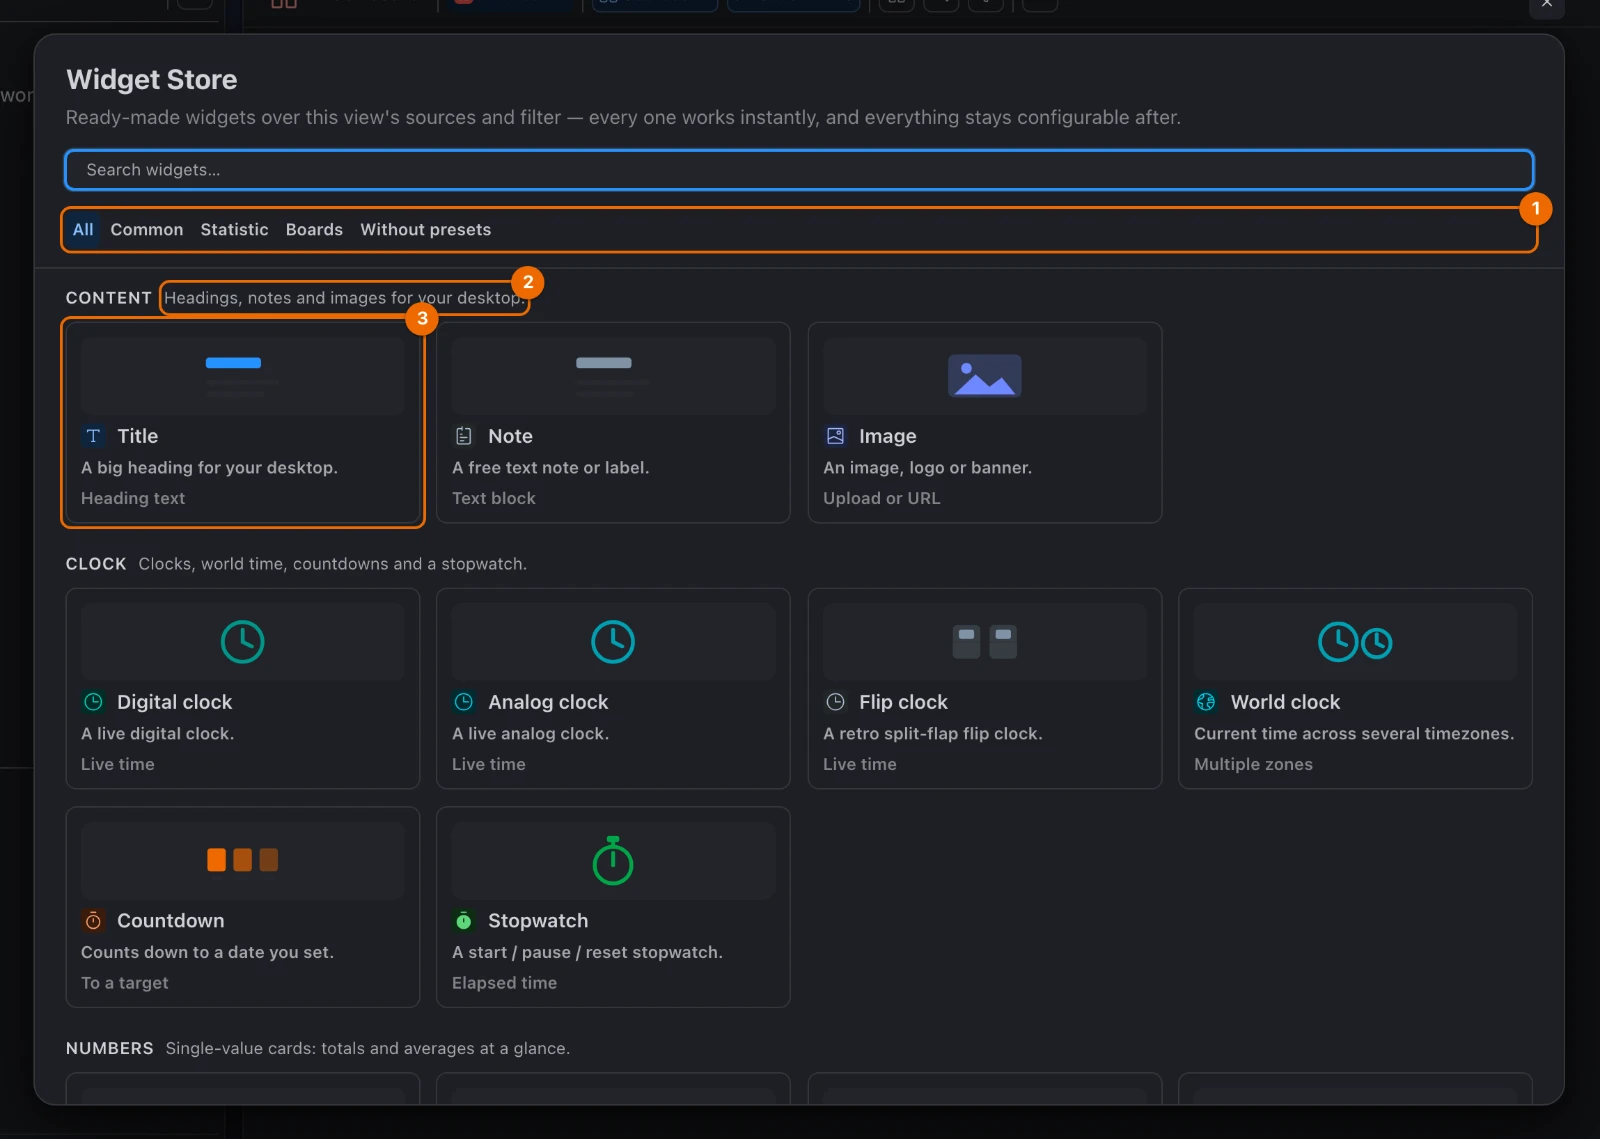
Pick a widget, such as Total tasks or Completed per week. It lands on the board. Some widgets, such as Note and the blank charts in Without presets, open Widget settings first: set them up and click Add.
Ready-made widgets count every task in the view
Done tasks count too, and so do subtasks when the view's Slice includes them. To count only open work, give the widget the filter Stage is not Done (Widget settings).
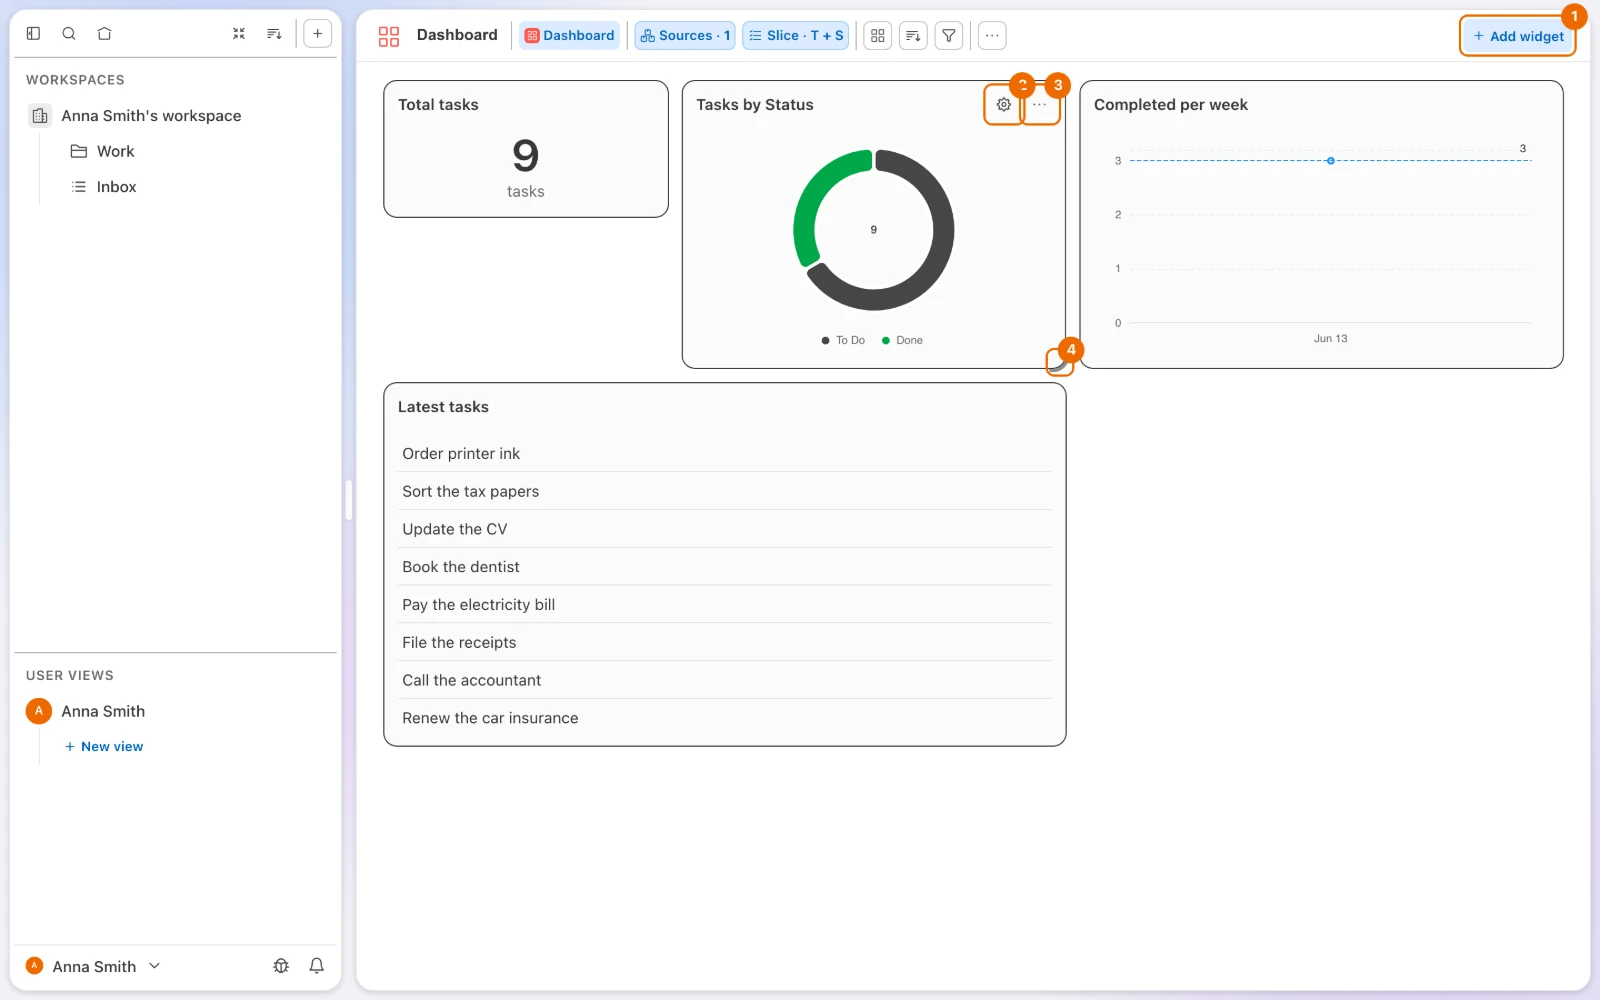
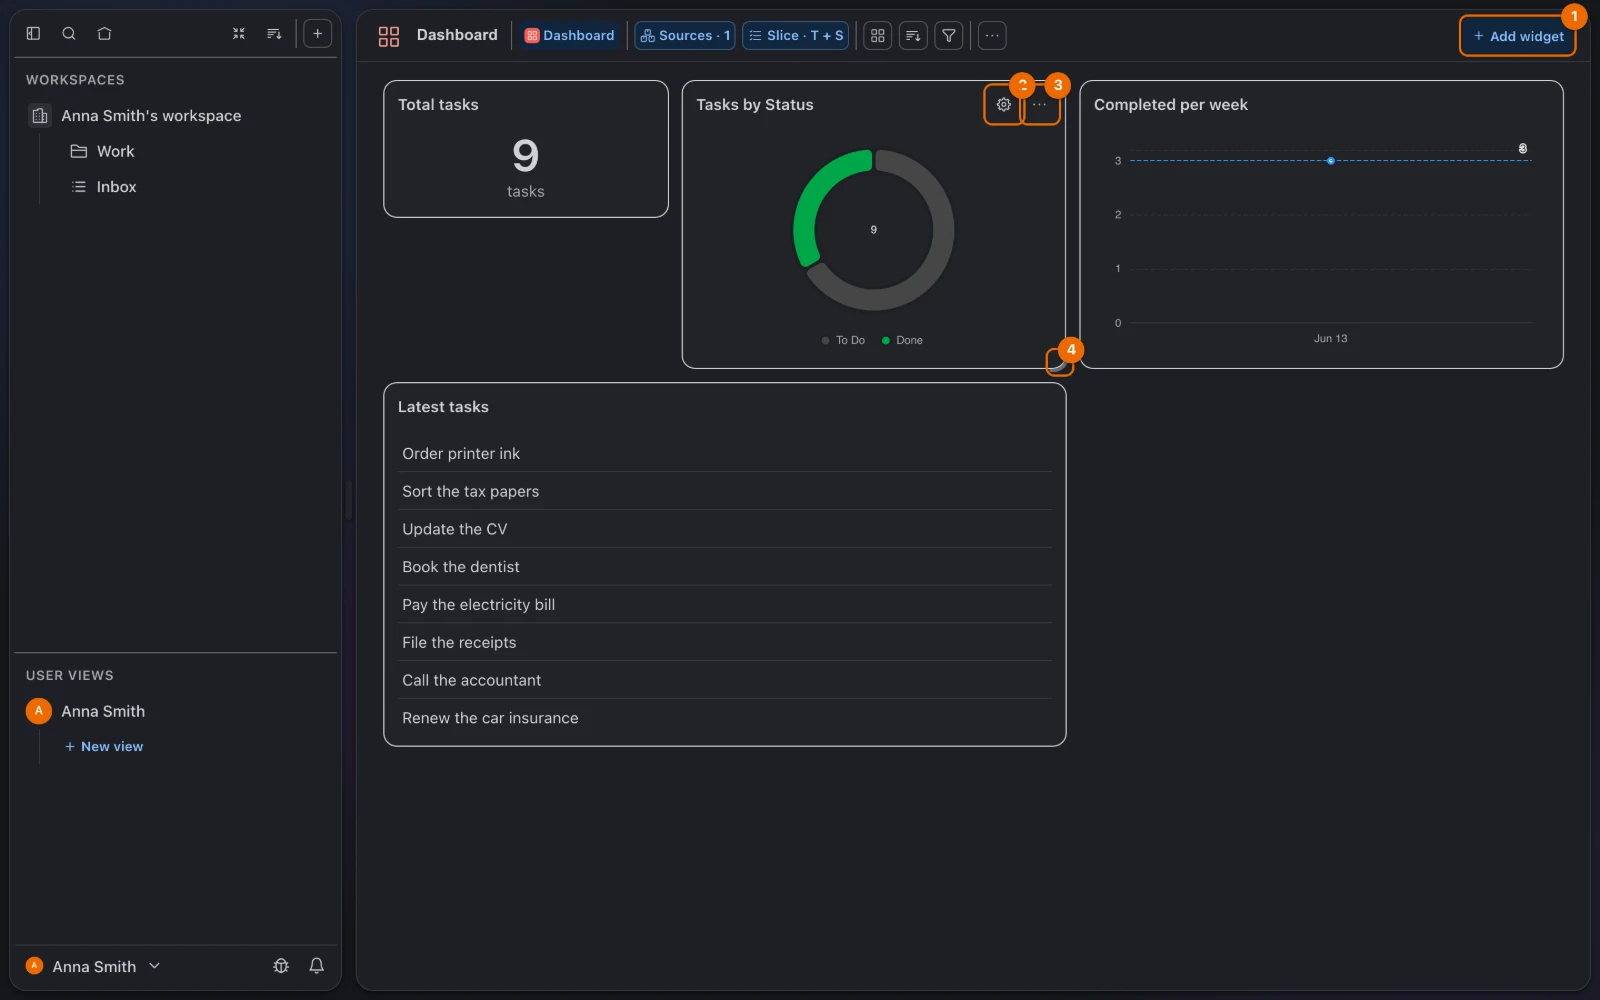
Drag the widget by its header to place it. A widget with no header, such as a note or an image, drags from anywhere on it. The other widgets make room.
Drag its edge to resize it. The dashboard saves as you go.
Widget settings
Click the widget's gear (Widget settings). Widget settings opens on the Widget tab, with the widget's title and description.
Open the General tab. For a chart you see Chart type and Group by, among other settings.
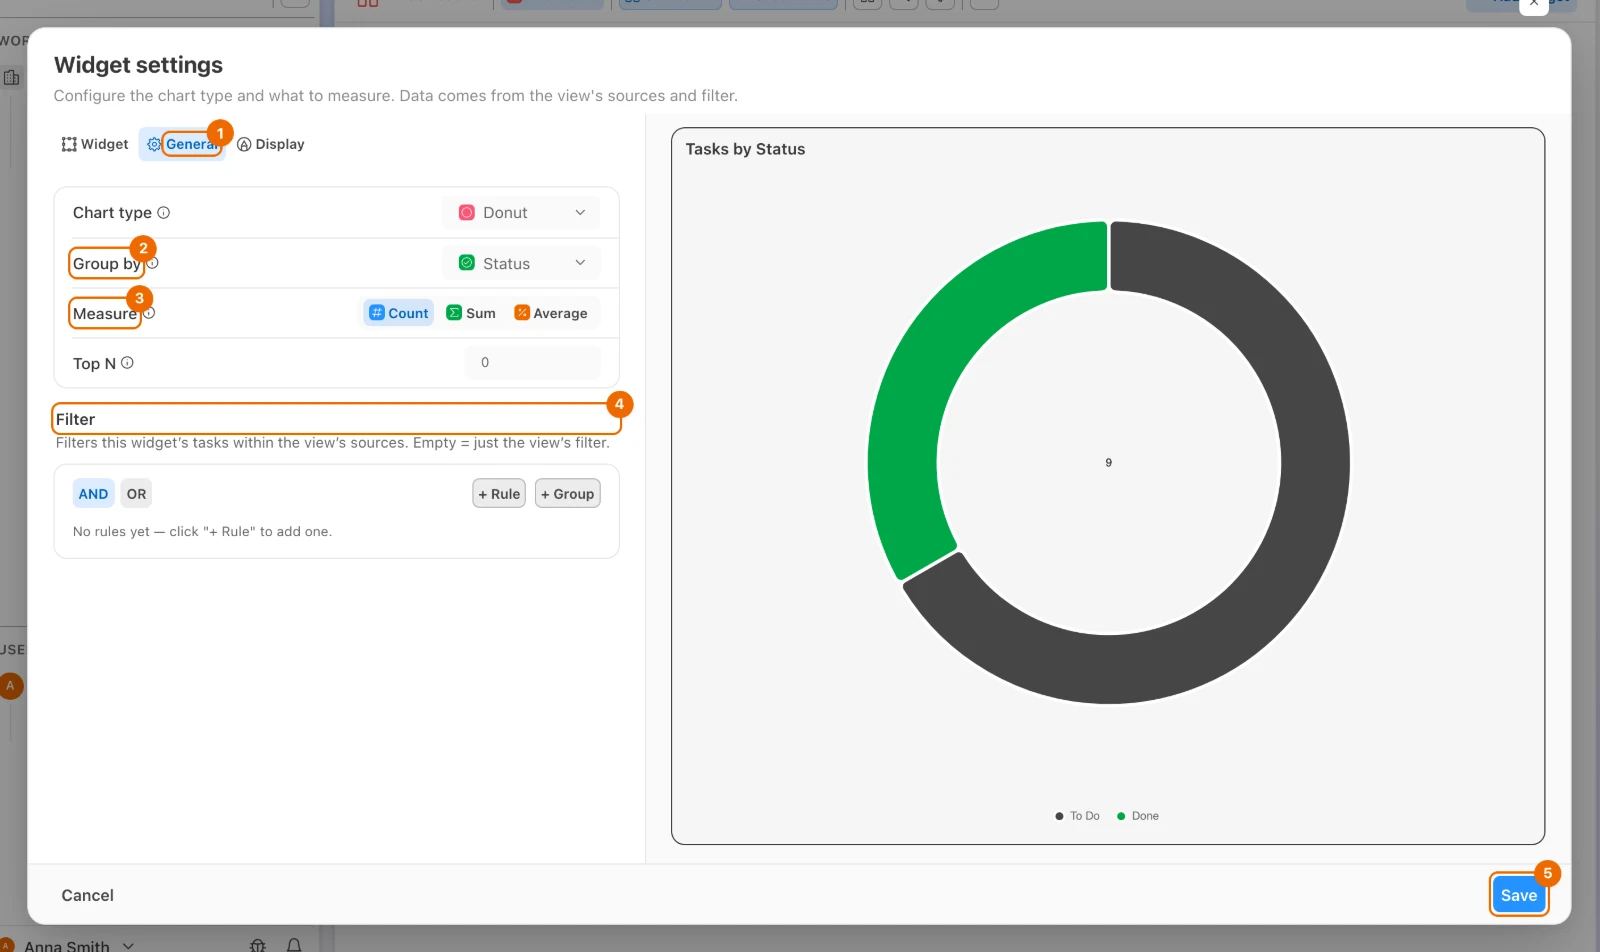
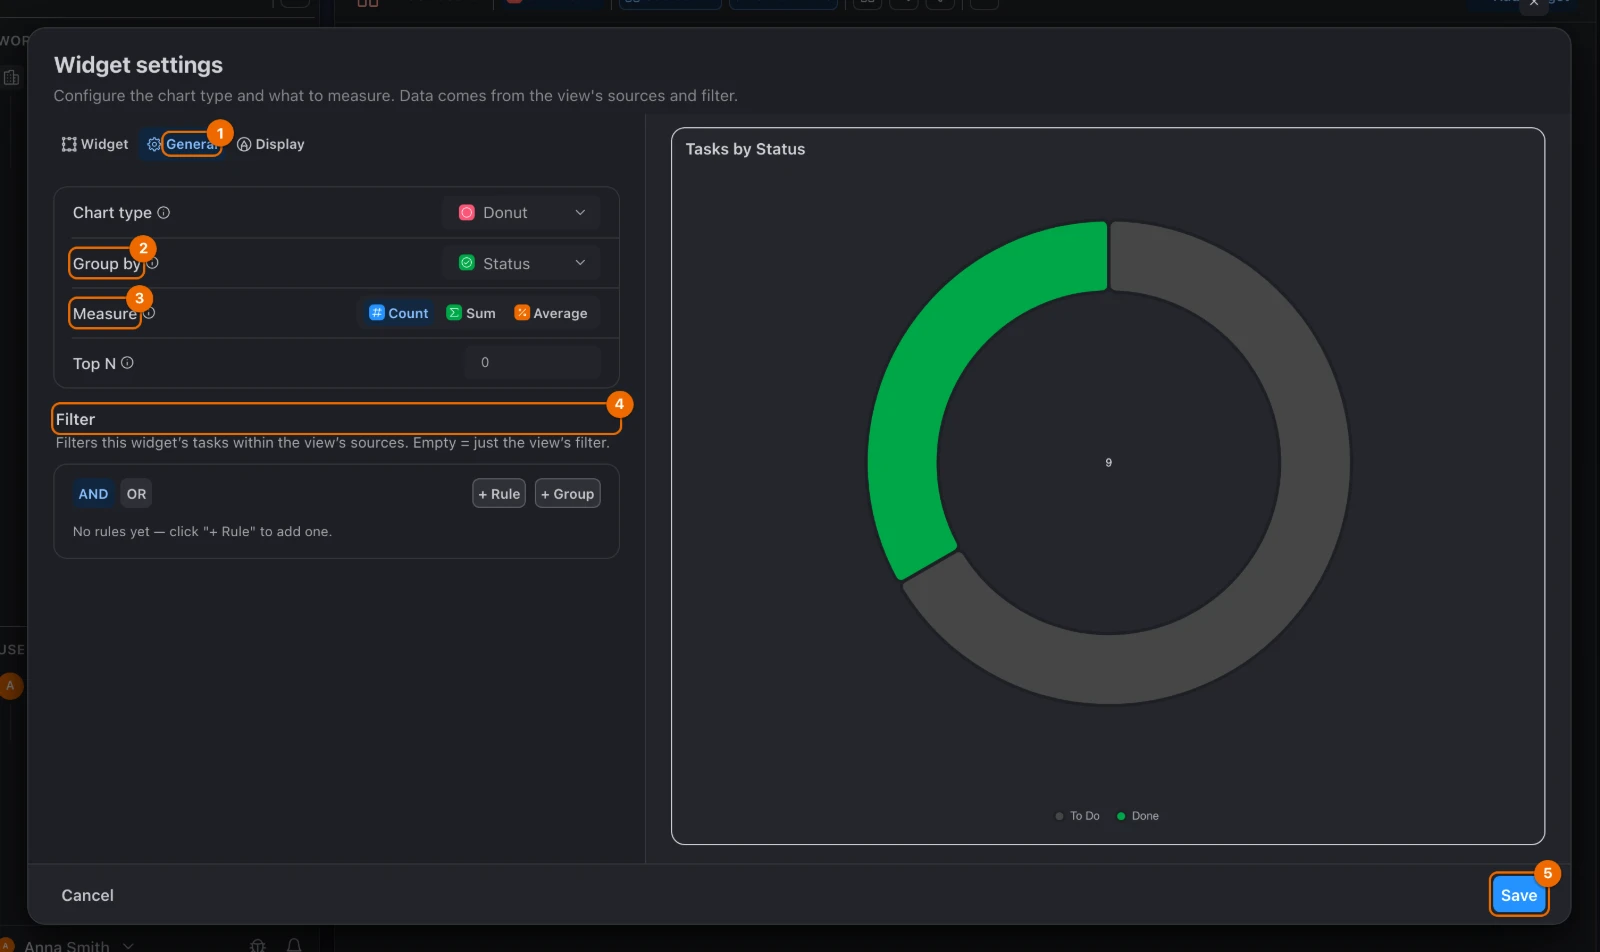
Change what it counts in these settings:
Setting What it does Choices Measure what the chart measures: a task count, or a sum or average of a field Count, Sum, Average Field the field a sum or an average is taken over Time estimate, Tracked time Bucket the step of the time axis, when you group by Created date or Completed date Day, Week, Month The widget's preview updates as you pick.
On the same tab, under Filter, narrow this widget further, for example to Stage is not Done. The rules work as in a view filter. The preview shows only the matching tasks.
A widget counts only the view's tasks
A widget has no source of its own. It starts from the view's sources and filter, and its own filter can only narrow them.
Click Save. The dialog closes and the widget redraws.
The widget's ⋯ menu has more:
| Item | What it does |
|---|---|
| Widget settings | opens Widget settings, as the gear does |
| Duplicate | adds a copy of the widget, with the same settings and size |
| Move | moves the widget a step at a time, without dragging; greyed out in a narrow window, where the board is one column |
| Size | resizes the widget a step at a time, without dragging its edge; greyed out in a narrow window, where the board is one column |
| Remove widget | takes the widget off the dashboard |
Removing a widget can't be undone
Remove widget acts at once, with no confirmation, and the widget's settings are lost.
Task charts in Dashboard V2
Use Dashboard V2 for quick charts of task counts or estimates, each set up in one dialog. A chart groups tasks by one of:
- Status;
- Assignee;
- Priority;
- List;
- Tag;
- Created date or Completed date.
Use Dashboard for notes, task lists, clocks and full widget styling. The two view types keep separate grids: switching a view between Dashboard and Dashboard V2 does not move widgets between them.
Create a view as in New dashboard view, choosing Dashboard V2 in Display Mode. The view opens on an empty grid with the line Add a chart to explore tasks from this view's source and filter.
Saving charts needs Edit access
On a list or folder view, saving needs Edit access to the view and a permission set that can update views (Permissions and access). Without them you see "Failed to save dashboard", and the grid goes back to how it was. Get them from a workspace admin, then make the change again.
Click Add chart. A bar chart of Task count by Status appears.
Drag the chart by its header to move it, or drag its edge to resize it. The grid saves both.
Click the chart's gear (Chart settings). Chart settings opens, with the chart under Preview.
Under Chart type, choose Pie. The preview becomes a circle divided by status.
Only valid combinations are offered
Group by offers only the choices that fit the chart type, and Number has none. If the current choice doesn't fit, Line switches it to Created date and Pie to Status.
Under Metric, choose what the chart measures:
- Task count;
- Total estimate (min);
- Average estimate (min).
The chart's header shows the metric you chose.
Under Widget filter, add a rule, for example Stage is not Done. It narrows the view's tasks, as in Widget settings. The chart under Preview shows only the matching tasks.
Click Save. The dialog closes and the chart redraws.
Each chart type takes these Group by choices:
| Chart type | Group by |
|---|---|
| Bar, Horizontal bar | any of the options above |
| Line | Created date or Completed date |
| Pie | Status, Assignee, Priority, List or Tag |
| Number | none: one number for all the chart's tasks |
Weekly dashboard for one person
A personal view set up like this:
- Display Mode: Dashboard;
- Source: every list you work in;
- Filter: none.
| Widget | Setting | Answers |
|---|---|---|
| Total tasks | filter: Stage is not Done | How much is open? |
| Due date outlook | filter: Stage is not Done | What is overdue or due soon? |
| Completed per week | — | Am I keeping a steady pace? |
| Created per week | — | How much new work arrives? |
| Tasks by List | filter: Stage is not Done | Where does open work pile up? |
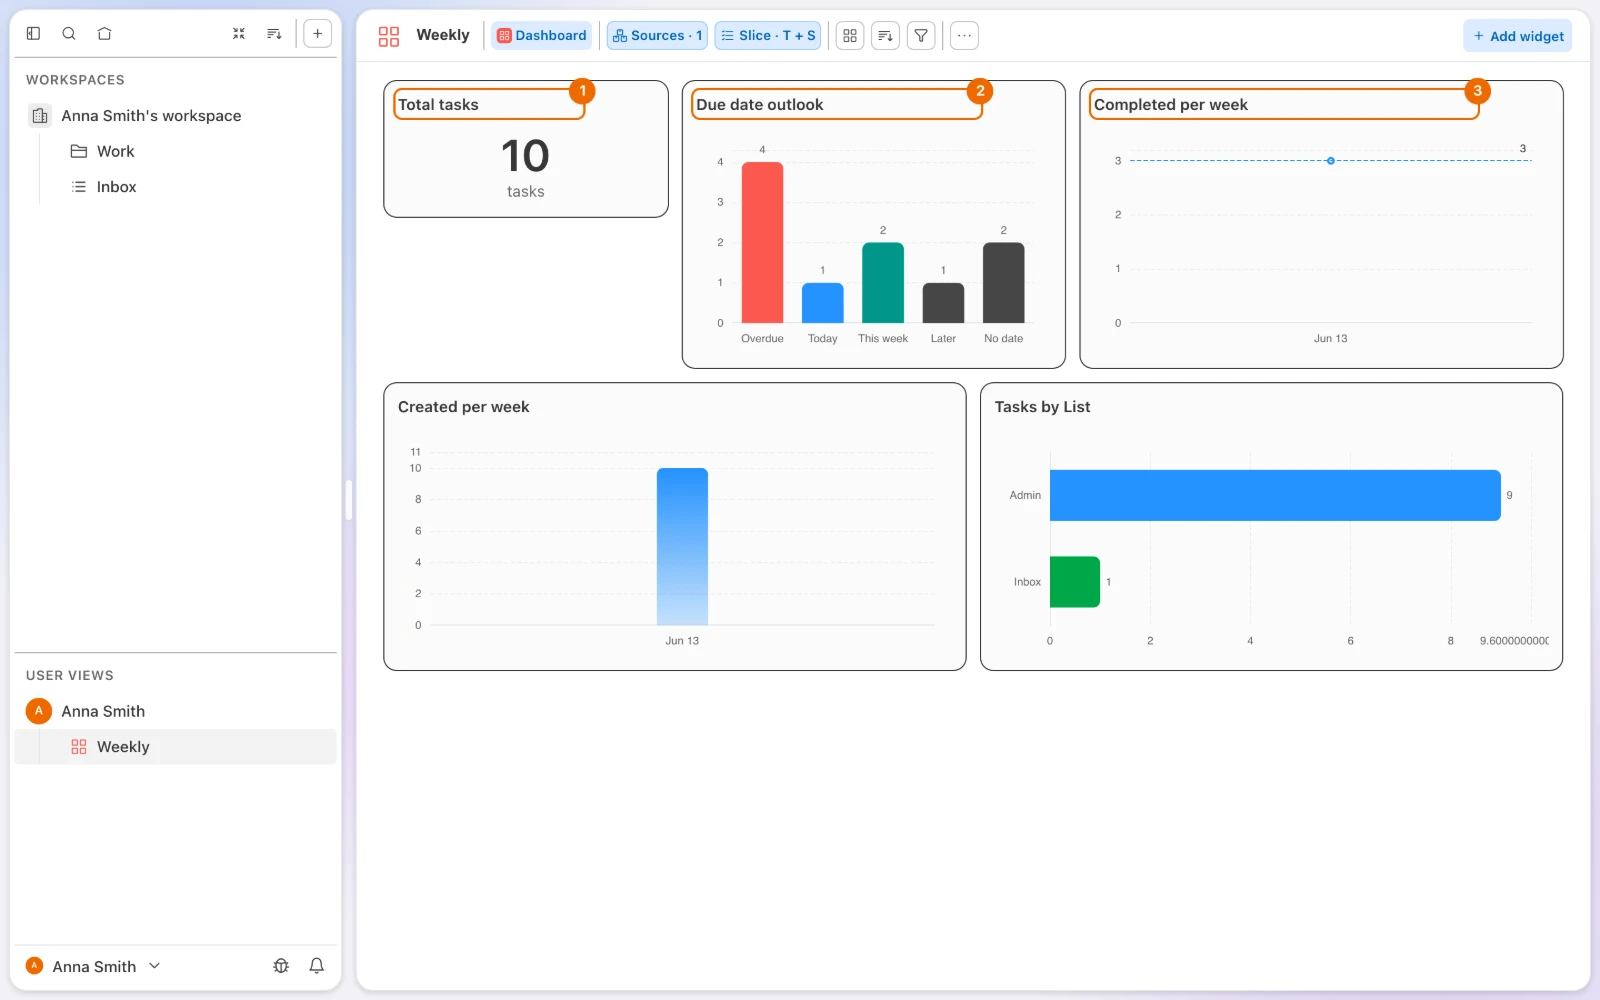
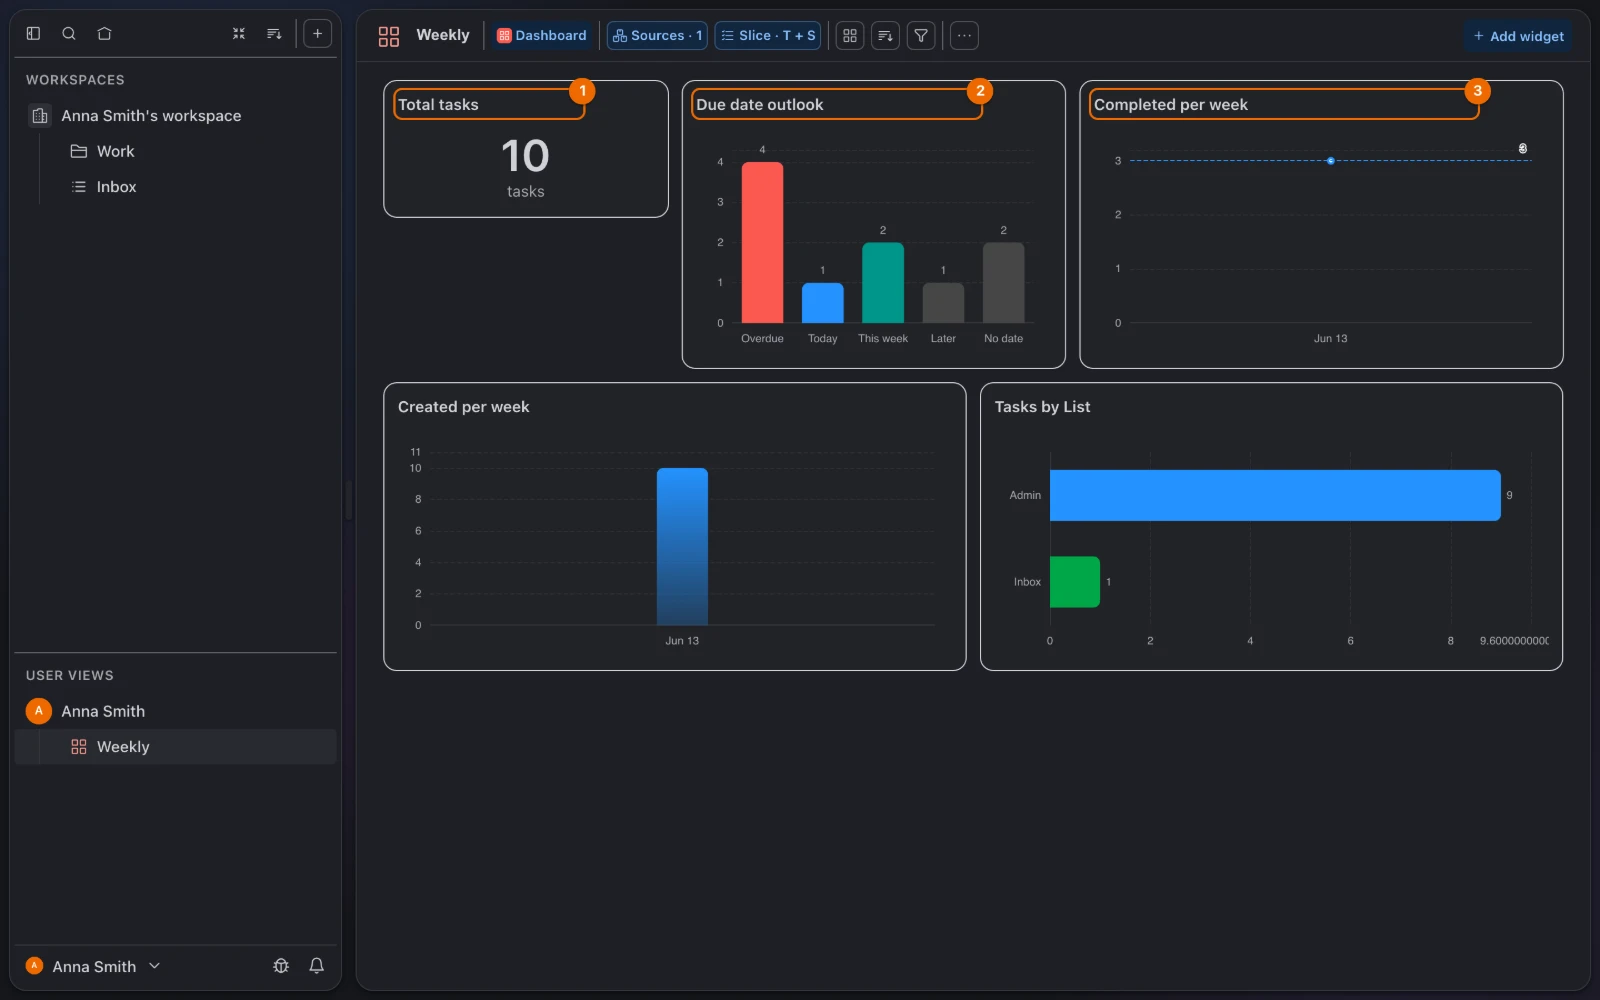
Open it on Friday during your weekly review.
If it doesn't work
- A widget shows fewer tasks, or tasks from the wrong place. Every widget reads the view's Sources and Filter, then its own filter; it has no source of its own. Check the view's sources and filter (Filter, sort and group a view), or make another dashboard with other sources.
- Total tasks shows more than the list has. The view's Slice counts subtasks too. Set the view's Slice chip (in the view's header) to Tasks; see Before you start.
- Due date outlook counts finished tasks as overdue. It counts every task with a past due date. Give the widget the filter Stage is not Done in its Widget settings.
- You removed a widget by mistake. Add it again from Add widget and set it up again: removed widgets keep no settings.
- You see "Failed to save dashboard". The change didn't save, and the dashboard went back to how it was. On a list or folder dashboard, the usual cause is access: Add widget or Add chart shows, but saving needs Edit access and a permission set that can update views (Permissions and access). Otherwise, make the change again.
- A chart or a widget says "No tasks in scope". No task passes the view's Source and Filter and then the chart's or widget's own filter. Loosen the chart's Widget filter in Chart settings, the widget's Filter in Widget settings, or the view's filter (Filter, sort and group a view).
- A chart says "Could not load chart data". The request for the chart's data failed. Reload the page; the chart asks for its data again.
- On a phone, the dashboard doesn't open. Phones don't show Dashboard views. A list's dashboard shows "The “Weekly” view is not supported yet"; a personal dashboard opens a list instead. Open the dashboard on a computer, in the browser or the desktop app.
Related
- Views as lenses on tasks: a dashboard is one more way to look at tasks.
- Build a lead's dashboard: a dashboard for a team lead.
- Filter, sort and group a view: the view filter every widget starts from.
- View filters: every rule a view or a widget filter can use.