Build a lead's dashboard
This recipe is for a team lead who wants to answer three questions in one glance every morning:
- Who is overloaded?
- What is late?
- Are we moving?
You build one Dashboard view over your team's folder and open it before the stand-up. How a view draws on its sources is explained in Views as lenses on tasks.
You need your team's folder, with the team's lists in it.
Access to create the dashboard
You need Edit access to the folder and a permission set that can create views, such as List/Folder manager. Without them, create the dashboard as a personal view in User Views (see the last variation).
Six widgets in two rows
| Row | Widget | Answers | Its own filter |
|---|---|---|---|
| 1 | Tasks by Assignee | Who carries how much open work | Stage none of Done |
| 1 | Urgency by person | Who has the urgent and high-priority tasks | Stage none of Done |
| 1 | Due date outlook | How much is overdue, due today, this week, later, or has no date | Stage none of Done |
| 2 | Completed per week | Is the team finishing more or less than before | none |
| 2 | Latest tasks | Which open tasks are late, by name | Due date before / less than Today (Relative), Stage none of Done |
| 2 | Progress overview | How much of the work is done | none |
The filter operators are listed in View filters.
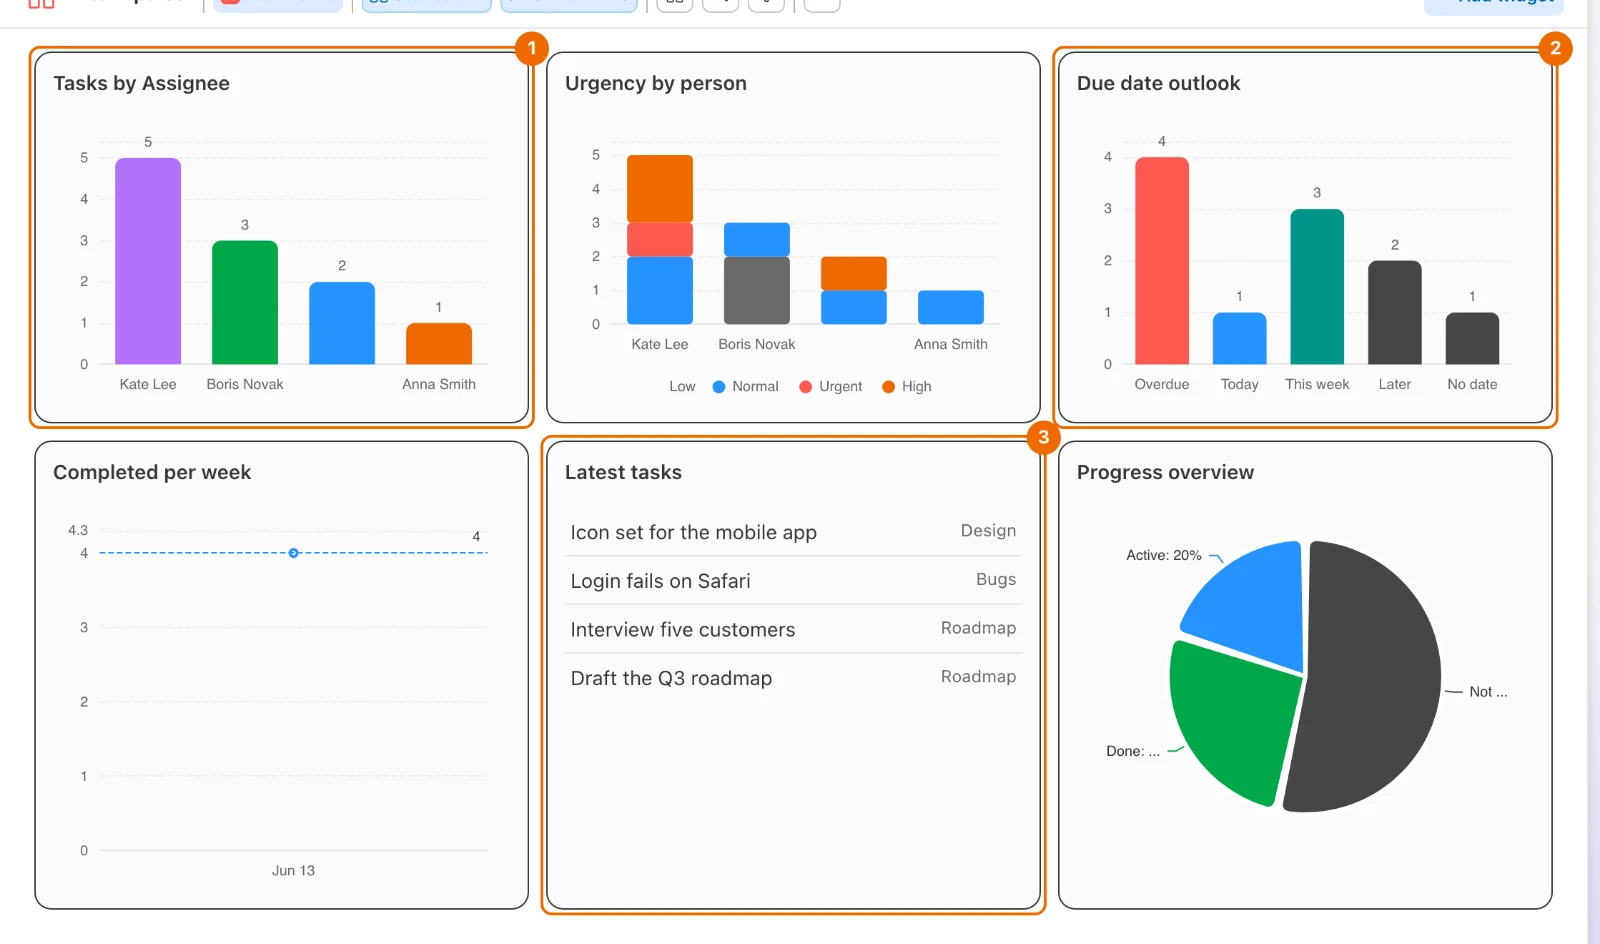
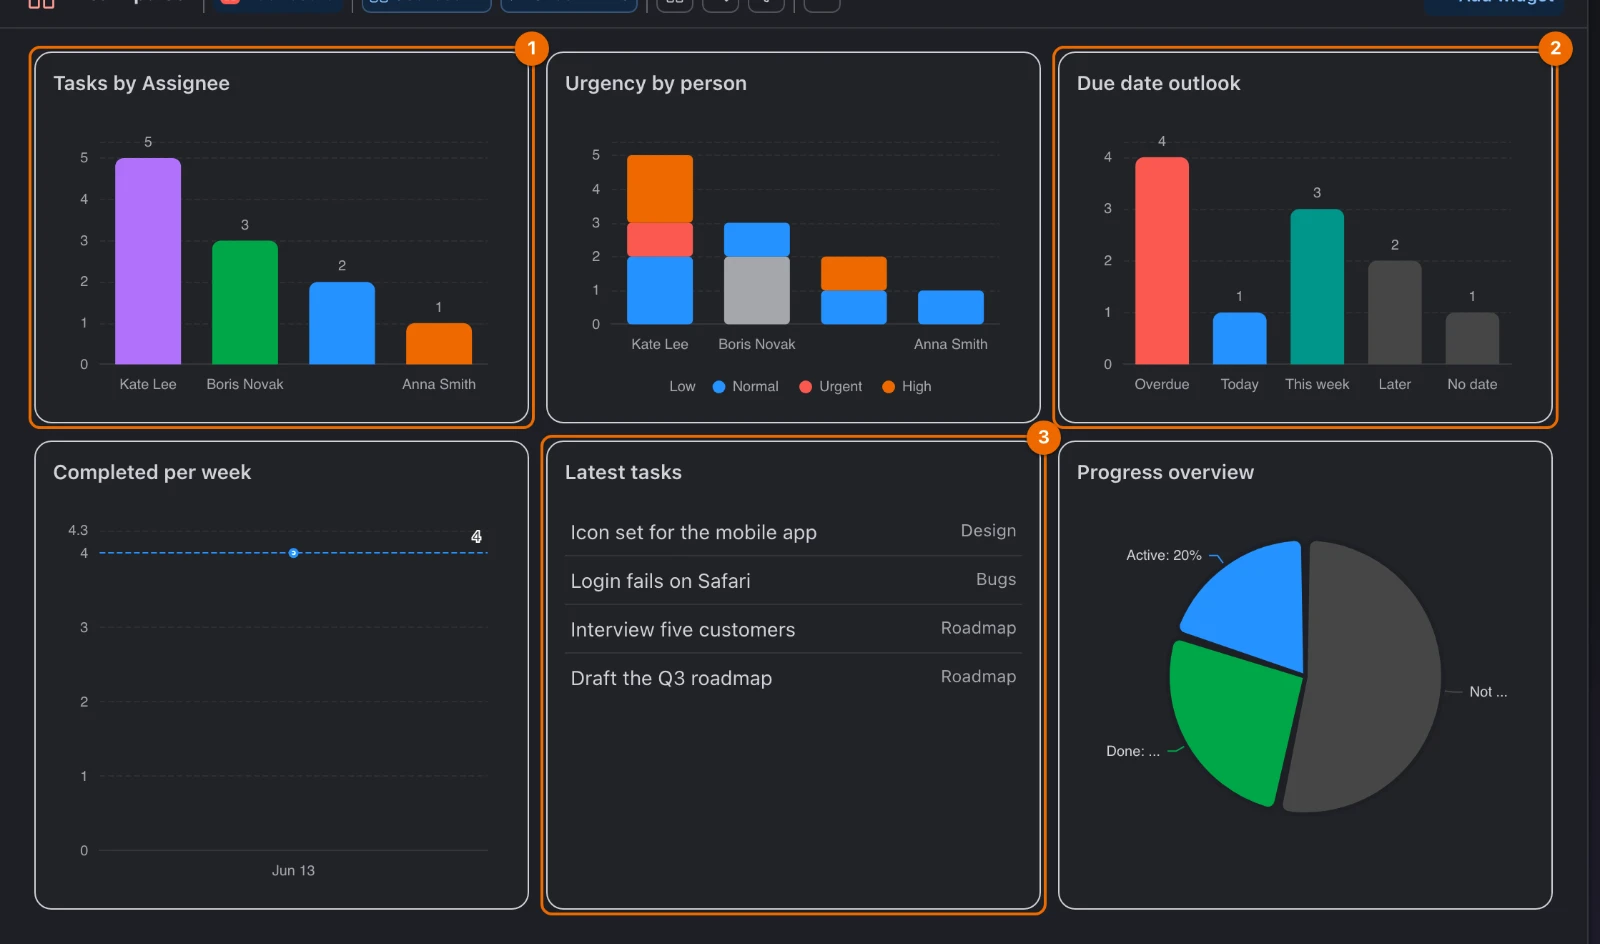
Dashboard setup in six steps
In the menu of your team's folder, choose New view. Name it Team pulse, set Display Mode to Dashboard and press Create (New dashboard view). An empty dashboard opens; its source is the folder.
Everyone in the folder sees this view
With Inherit access on (the default), everyone with access to the folder sees it. To keep the folder's members out, switch Inherit access off in the form. To keep it to yourself, create it in User Views instead (Private branches).
Press Add widget and add the six widgets from the table, one by one (Add widgets). Each widget appears on the board.
Resize each widget to 4 columns wide by dragging its edge, or with ⋯ → Size → Wider / Narrower, one column per click (Widget settings). The board is 12 columns wide, so three fit in a row.
Drag the widgets into two rows of three. The six widgets sit three to a row, as in the picture above.
Click each widget's gear (Widget settings) and set its Filter as the table says (Widget settings). The widget redraws with the filtered count.
Leave the view unfiltered
Put Stage none of Done on the four widgets, not on the view. A view filter also hides finished work: Completed per week drops to zero and Progress overview loses its Done share.
In the view's menu, choose Pin to… → Sidebar (Pin lists, folders and views). Team pulse appears among the pins at the top of the sidebar.
Stand-up and weekly reading
Before the stand-up, two minutes. Open Team pulse.
- A tall bar in Tasks by Assignee or Urgency by person means one person has more open work than the others: reassign something at the stand-up.
- A growing Overdue bar in Due date outlook means dates are unrealistic: ask for new ones.
- Read the task names in Latest tasks and raise them at the stand-up. The rows can't be clicked: to see a task, open it from its list or search for its name.
More rows in Latest tasks
Latest tasks lists the 25 most recently active tasks. To list more, raise Max rows in its Widget settings, up to 100.
Once a week. Look at Completed per week. The dashed line is the average, so a week below it stands out.
Wrong counts: missing or extra tasks
| You see | Why | Fix |
|---|---|---|
| A widget counts finished tasks | Its own Filter lacks Stage none of Done | Add it in the widget's Filter; see Widget settings |
| A widget shows fewer tasks than you expect | The view's filter applies to every widget | Check the view's filter first, then the widget's own Filter; see View filters |
| A teammate's tasks are missing | The view sees only lists in its sources that you have access to | Add the list in the view's Sources; if you have no access to it, ask for a share (Share a folder or a list) |
| Everyone sees your dashboard | A view created on a folder is shared with everyone who has access to that folder, because Inherit access is on | Turn it off in the view's share dialog (⋯ → Share…) to keep the folder's members out, or create the view in User Views to keep it to yourself; see Private branches |
Variations: time, custom charts, several workspaces
Time, not tasks. Swap Tasks by Assignee for Estimate by Assignee and add Time logged by List if your team tracks time.
Your own chart. Custom chart groups tasks by the field in Group by (such as Tag or List). Set Measure to one of:
- Count
- Sum
- Average
For Sum or Average, pick Time estimate or Tracked time in Field. All options: Widget settings.
A dashboard across workspaces. Create it as a personal view in User Views, with several workspaces as its sources, if you lead people in more than one workspace; see Keep personal and work tasks together.